Result
- Heatmap
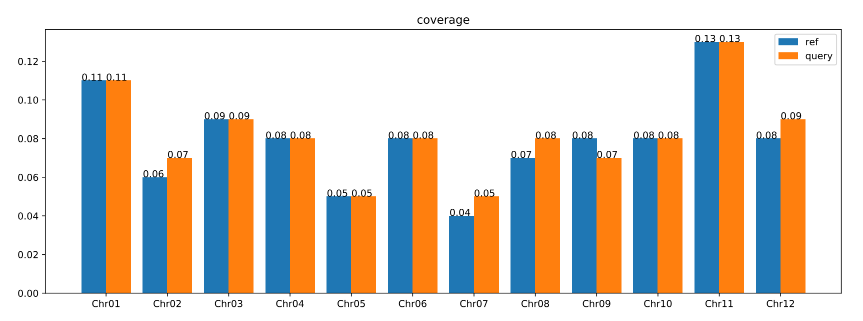
- Identity and Coverage
The heatmap can make detailed statistics of the coincidence ratio between the compared genomes, which can reflect the synteny of the compared genomes.
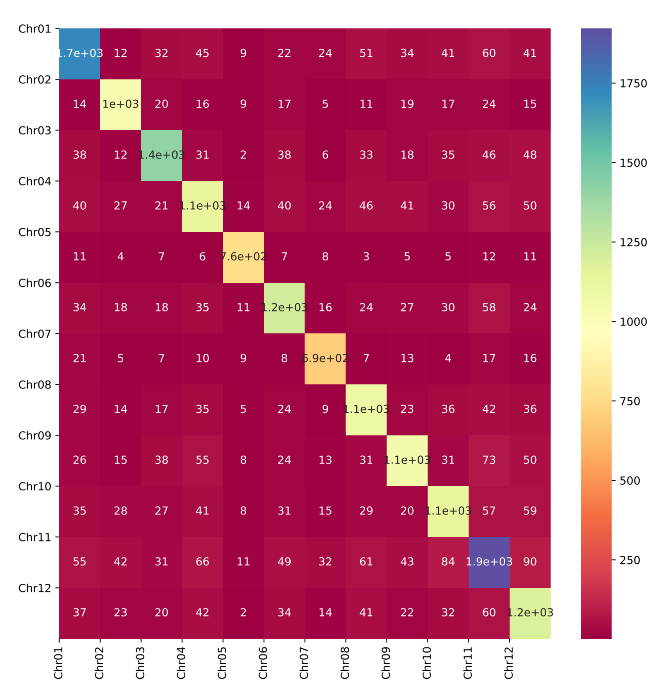
The heatmap display fully shows which two chromosomes have more synteny segments and which two chromosomes have fewer synteny segments.
The more red the square, the more the number of synteny segments between the two chromosomes, and the bluer the less.
Bedtools is a powerful toolset for genome arithmetic. It is also very easy to install. In this pipeline, four sub-tools of Bedtools are used: getfasta, intersect, merge and sort.
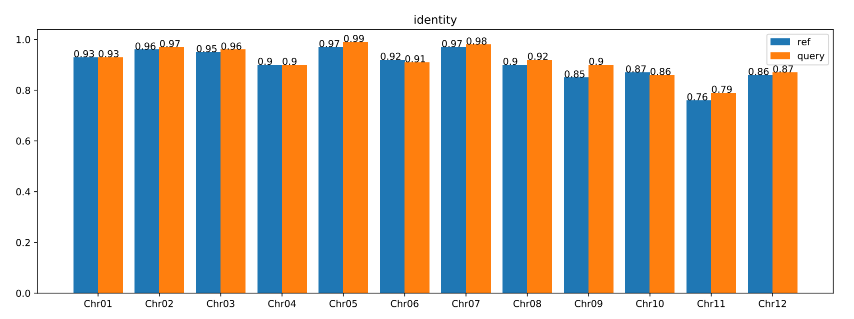
Identity shows the proportion of the synteny region in the entire chromosome.
Coverage shows the average coverage of the synteny blocks.